
Page 251 - Profile's Unit Trusts & Collective Investments - March 2025
P. 251
Alusi RealFin Managed Fund
Alusi RealFin Managed Fund
Alusi RealFin Managed Fund
Sector: South African—Multi
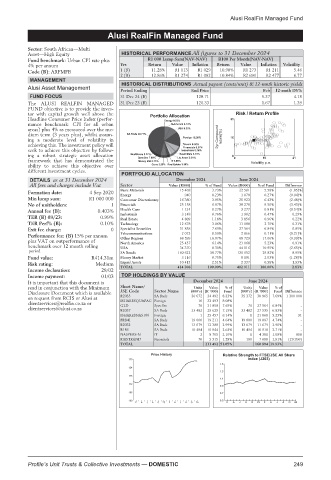
Asset—High Equity HISTORICAL PERFORMANCE All figures to 31 December 2024
Fund benchmark: Urban CPI rate plus R1 000 Lump Sum(NAV-NAV) R100 Per Month(NAV-NAV)
4% per annum Yrs Return Value Inflation Return Value Inflation Volatility
Code (B): ARFMFB 1 (B) 11.28% R1 113 R1 029 10.90% R1 273 R1 211 5.46
2 (B) 12.86% R1 274 R1 082 10.84% R2 691 R2 477 6.77
MANAGEMENT
HISTORICAL DISTRIBUTIONS Actual payout (cents/unit) & 12-mnth historic yields
Alusi Asset Management
Period Ending End Price Feb 12-mnth DY%
FUND FOCUS 31 Dec 24 (B) 128.71 5.37 4.18
The ALUSI REALFIN MANAGED 31 Dec 23 (B) 120.33 1.67 1.39
FUND objective is to provide the inves-
tor with capital growth well above the Risk / Return Profile
Headline Consumer Price Index (perfor- 31
mance benchmark: CPI for all urban
areas) plus 4% as measured over the me-
dium term (3 years plus), whilst assum- 2yr Compound return(%)
ing a moderate level of volatility in 16
achieving this. The investment policy will
seek to achieve this objective by follow-
ing a robust strategic asset allocation 0
10
framework that has demonstrated the 0 Volatility p.a. 21
ability to achieve this objective over
different investment cycles.
PORTFOLIO ALLOCATION
DETAILS as at 31 December 2024 December 2024 June 2024
All fees and charges include Vat Sector Value (R000) % of Fund Value (R000) % of Fund Difference
Basic Materials 15 468 3.73% 22 501 5.58% (1.85)%
Formation date: 4 Sep 2020
Energy 940 0.23% 1 070 0.27% (0.04)%
Min lump sum: R1 000 000 Consumer Discretionary 16 380 3.95% 25 923 6.43% (2.48)%
No of unitholders: 1 Financials 25 158 6.07% 38 270 9.50% (3.43)%
Annual fee (B): 0.403% Health Care 1 134 0.27% 3 277 0.81% (0.54)%
Industrials 3 148 0.76% 1 902 0.47% 0.29%
TER (B) 09/23: 0.99% Real Estate 4 889 1.18% 3 856 0.96% 0.22%
TER Perf% (B): 0.10% Technology 12 678 3.06% 11 088 2.75% 0.31%
Exit fee charge: 0 Specialist Securities 31 858 7.69% 27 564 6.84% 0.85%
Telecommunications 2 073 0.50% 2 866 0.71% (0.21)%
Performance fee: (B) 15% per annum Other Regions 66 599 16.07% 68 729 17.06% (0.99)%
plus VAT on outperformance of North America 25 457 6.14% 21 068 5.23% 0.91%
benchmark over 12 month rolling USA 34 370 8.30% 44 116 10.95% (2.65)%
period SA Bonds 160 622 38.77% 120 152 29.82% 8.95%
Fund value: R414.31m Money Market 3 116 0.75% 8 191 2.03% (1.28)%
2.51%
0.58%
2 337
10 413
1.93%
Risk rating: Medium Liquid Assets 414 306 100.00% 402 911 100.00% 2.83%
TOTAL
Income declaration: 28/02
Income payment: 01/03 TOP HOLDINGS BY VALUE
It is important that this document is December 2024 June 2024
read in conjunction with the Minimum Short Name/ Units Value %of Units Value %of
Disclosure Document which is available JSE Code Sector Name (000’s) (R ‘000) Fund (000’s) (R ‘000) Fund Difference
on request from RCIS or Alusi at R2035 SA Bnds 36 672 34 492 8.33% 35 372 30 965 7.69% 1 300 000
clientservices@realfin.co.za or ISHARESQUAFAC Foreign 10 33 493 8.08% 70 27 564 6.84% -
7.69%
SpecSec
GLD
31 858
70
clientservices@alusi.co.za R2037 SA Bnds 33 482 29 629 7.15% 33 482 27 535 6.83% -
ISHARESNAS100 Foreign 1 25 457 6.14% 1 21 068 5.23% 91
FRB41 SA Bnds 19 000 19 211 4.64% 19 000 19 097 4.74% -
R2032 SA Bnds 13 079 12 388 2.99% 13 079 11 679 2.90% -
R186 SA Bnds 10 494 10 944 2.64% 10 494 10 918 2.71% -
NASPERS-N IT 2 8 705 2.10% 1 4 381 1.09% 858
FIRSTRAND Financials 70 5 315 1.28% 100 7 688 1.91% (29 996)
TOTAL 211 492 51.05% 160 894 39.93%
Price History Relative Strength to FTSE/JSE All Share
130 index (J203)
1.5
124
1.3
118
1.1
112
0.9
106 0.7
100 0.5
F A J A O 23 F A J A O 24 F A J A O 23 F A J A O 24
Profile’s Unit Trusts & Collective Investments — DOMESTIC 249