
Page 73 - Profiles's Unit Trusts & Collective Investments - September 2024
P. 73
Costs and Pricing
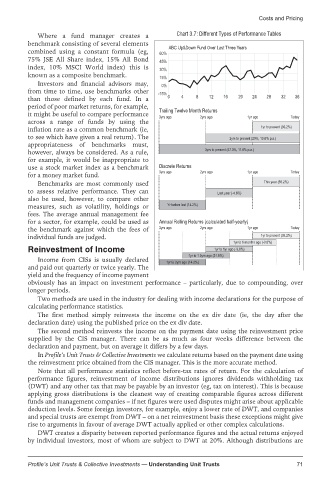
Where a fund manager creates a Chart 3.7: Different Types of Performance Tables
benchmark consisting of several elements
ABC Up&Down Fund Over Last Three Years
combined using a constant formula (eg, 60%
75% JSE All Share index, 15% All Bond 45%
index, 10% MSCI World index) this is
30%
known as a composite benchmark.
15%
Investors and financial advisors may, 0%
from time to time, use benchmarks other
-15%
than those defined by each fund. In a 0 4 8 12 16 20 24 28 32 36
period of poor market returns, for example,
Trailing Twelve Month Returns
it might be useful to compare performance
3yrs ago 2yrs ago 1yr ago Today
across a range of funds by using the
inflation rate as a common benchmark (ie, 1yr to present (35.2%)
to see which have given a real return). The 2yrs to present (29%, 13.6% p.a.)
appropriateness of benchmarks must,
however, always be considered. As a rule, 3yrs to present (47.3%, 11.8% p.a.)
for example, it would be inappropriate to
use a stock market index as a benchmark Discrete Returns
3yrs ago 2yrs ago 1yr ago Today
for a money market fund.
Benchmarks are most commonly used This year (35.2%)
to assess relative performance. They can Last year (-4.6%)
also be used, however, to compare other
measures, such as volatility, holdings or Yr before last (14.2%)
fees. The average annual management fee
for a sector, for example, could be used as Annual Rolling Returns (calculated half-yearly)
the benchmark against which the fees of 3yrs ago 2yrs ago 1yr ago Today
individual funds are judged. 1yr to present (35.2%)
1yr to 6 months ago (-3.6%)
Reinvestment of Income 1yr to 1yr ago (-3.6%)
1yr to 1.5yrs ago (31.9%)
Income from CISs is usually declared
1yr to 2yrs ago (14.2%)
and paid out quarterly or twice yearly. The
yield and the frequency of income payment
obviously has an impact on investment performance – particularly, due to compounding, over
longer periods.
Two methods are used in the industry for dealing with income declarations for the purpose of
calculating performance statistics.
The first method simply reinvests the income on the ex div date (ie, the day after the
declaration date) using the published price on the ex div date.
The second method reinvests the income on the payment date using the reinvestment price
supplied by the CIS manager. There can be as much as four weeks difference between the
declaration and payment, but on average it differs by a few days.
In Profile’s Unit Trusts & Collective Investments we calculate returns based on the payment date using
the reinvestment price obtained from the CIS manager. This is the more accurate method.
Note that all performance statistics reflect before-tax rates of return. For the calculation of
performance figures, reinvestment of income distributions ignores dividends withholding tax
(DWT) and any other tax that may be payable by an investor (eg, tax on interest). This is because
applying gross distributions is the cleanest way of creating comparable figures across different
funds and management companies – if net figures were used disputes might arise about applicable
deduction levels. Some foreign investors, for example, enjoy a lower rate of DWT, and companies
and special trusts are exempt from DWT – on a net reinvestment basis these exceptions might give
rise to arguments in favour of average DWT actually applied or other complex calculations.
DWT creates a disparity between reported performance figures and the actual returns enjoyed
by individual investors, most of whom are subject to DWT at 20%. Although distributions are
Profile’s Unit Trusts & Collective Investments — Understanding Unit Trusts 71