
Page 312 - Profiles's Unit Trusts & Collective Investments - September 2024
P. 312
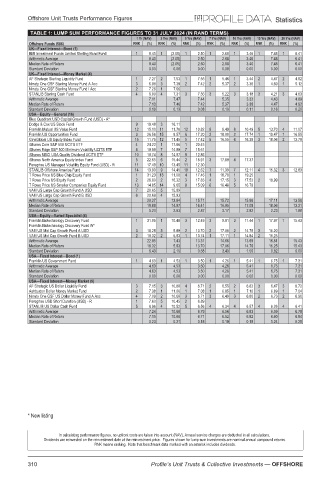
Offshore Unit Trusts Performance Figures                              Statistics

          TABLE 1: LUMP SUM PERFORMANCE FIGURES TO 31 JULY 2024 (IN RAND TERMS)
                                        1 Yr (NAV)  3 Yrs (NAV)  5 Yrs (NAV)  7 Yrs (NAV)  10 Yrs (NAV)  15 Yrs (NAV)  20 Yrs (NAV)
         Offshore Funds (586)          RNK  (%)  RNK  (%)  RNK  (%)  RNK  (%)  RNK  (%)  RNK  (%)  RNK  (%)
         UK—Fixed Interest—Bond (1)
         BMI Investment Funds Limited Sterling Bond Fund  1  8.40  1  (2.05)  1  2.50  1  2.68  1  3.46  1  7.48  1  6.41
         Arithmetic Average                8.40   (2.05)  2.50  2.68   3.46   7.48   6.41
         Median Rate of Return             8.40   (2.05)  2.50  2.68   3.46   7.48   6.41
         Standard Deviation                0.00   0.00   0.00   0.00   0.00   0.00   0.00
         UK—Fixed Interest—Money Market (4)
         AF Strategic Sterling Liquidity Fund  1  7.27  2  7.53  1  7.55  1  5.46  1  3.44  2  4.47  2  4.92
         Ninety One GSF Sterling Money Fund A Acc  3  6.99  3  7.39  2  7.42  2  5.37  2  3.38  1  4.60  1  5.12
         Ninety One GSF Sterling Money Fund I Acc  2  7.26  1  7.66
         STANLIB Sterling Cash Fund     4  6.90  4  7.31  3  7.36  3  5.22  3  3.18  3  4.21  3  4.63
         Arithmetic Average                7.11   7.47   7.44   5.35   3.33   4.43   4.89
         Median Rate of Return             7.13   7.46   7.42   5.37   3.38   4.47   4.92
         Standard Deviation                0.16   0.13   0.08   0.10   0.11   0.16   0.20
         USA—Equity—General (16)
         Blue Quadrant USD Capital Growth Fund (USD) - A*
         Dodge & Cox US Stock Fund      9  19.48  3  16.11
         Franklin Mutual US Value Fund  12  15.10 11  11.70 12  10.82  8  9.49  8  10.49  5  13.70  4  11.07
         Franklin US Opportunities Fund  3  26.56 15  8.57  6  17.20  2  18.00  2  17.74  1  19.47  1  16.55
         GinsGlobal US Equity Index Fund  15  11.75 12  11.45  5  17.42  5  16.55  6  16.39  3  18.06  2  13.79
         iShares Core S&P 500 UCITS ETF  4  24.23  1  17.66  1  20.45
         iShares Edge S&P 500 Minimum Volatility UCITS ETF  8  19.89  7  14.99  7  15.61
         iShares MSCI USA Quality Dividend UCITS ETF  10  18.74  8  14.97  9  12.86
         iShares North America Equity Index Fund  5  22.65  6  15.44  2  18.91  3  17.89  4  17.37
         Peregrine US Managed Volatility Equity Fund (USD) - R  11  17.49 10  13.45 11  12.30
         STANLIB Offshore America Fund  14  13.90  9  14.45 10  12.62  7  11.39  7  12.11  4  15.32  3  12.83
         T Rowe Price US Blue Chip Equity Fund  1  31.23 13  11.08  4  17.46  1  18.78  1  19.25
         T Rowe Price US Equity Fund    2  26.90  2  16.32  3  17.83  4  17.15  3  17.52  2  18.99
         T Rowe Price US Smaller Companies Equity Fund  13  14.85 14  9.65  8  15.09  6  16.48  5  16.79
         VAM US Large Cap Growth Fund A USD  7  20.65  5  15.89
         VAM US Large Cap Growth Fund B USD  6  20.69  4  15.93
         Arithmetic Average                20.27  13.84  15.71  15.72  15.96  17.11  13.56
         Median Rate of Return             19.89  14.97  16.41  16.85  17.08  18.06  13.31
         Standard Deviation                5.20   2.63   2.87   3.17   2.83   2.23   1.98
         USA—Equity—Varied Specialist (4)
         Franklin Biotechnology Discovery Fund  1  31.95  1  10.48  3  12.49  3  9.81  3  11.44  1  17.97  1  15.43
         Franklin Biotechnology Discovery Fund W*
         VAM US Mid Cap Growth Fund A USD  3  18.28  3  5.89  2  13.70  2  17.06  2  14.79  3  16.20
         VAM US Mid Cap Growth Fund B USD  2  18.32  2  5.93  1  13.74  1  17.11  1  14.84  2  16.25
         Arithmetic Average                22.85  7.43   13.31  14.66  13.69  16.81  15.43
         Median Rate of Return             18.32  5.93   13.70  17.06  14.79  16.25  15.43
         Standard Deviation                6.43   2.15   0.58   3.43   1.59   0.82   0.00
         USA—Fixed Interest—Bond (1)
         Franklin US Government Fund    1  4.63  1  4.53  1  3.50  1  4.26  1  5.41  1  6.75  1  7.31
         Arithmetic Average                4.63   4.53   3.50   4.26   5.41   6.75   7.31
         Median Rate of Return             4.63   4.53   3.50   4.26   5.41   6.75   7.31
         Standard Deviation                0.00   0.00   0.00   0.00   0.00   0.00   0.00
         USA—Fixed Interest—Money Market (5)
         AF Strategic US Dollar Liquidity Fund  3  7.15  3  10.68  4  6.71  2  6.55  2  6.83  3  6.47  3  6.72
         Ashburton Dollar Money Market Fund  2  7.38  1  11.06  1  7.08  1  6.85  1  7.10  1  6.89  1  7.04
         Ninety One GSF US Dollar Money Fund A Acc  4  7.09  2  10.68  3  6.71  3  6.49  3  6.80  2  6.73  2  6.96
         Peregrine USD Short Duration (USD) - R  1  7.60  5  10.45  2  6.89
         STANLIB US Dollar Cash Fund    5  6.96  4  10.52  5  6.56  4  6.34  4  6.57  4  6.26  4  6.41
         Arithmetic Average                7.24   10.68  6.79   6.56   6.83   6.59   6.78
         Median Rate of Return             7.15   10.68  6.71   6.52   6.82   6.60   6.84
         Standard Deviation                0.23   0.21   0.18   0.19   0.19   0.24   0.25


         * New listing


                  In calculating performance figures, no upfront costs are taken into account (NAV). Annual service charges are deducted in all calculations.
              Dividends are reinvested on the reinvestment date at the reinvestment price. Figures shown for lump sum investments are nominal annual compound returns.
                            RNK means ranking. Note that benchmark data marked with an asterisk includes dividends.

         310                                Profile’s Unit Trusts & Collective Investments — OFFSHORE