
Page 213 - Profiles's Unit Trusts & Collective Investments - September 2024
P. 213
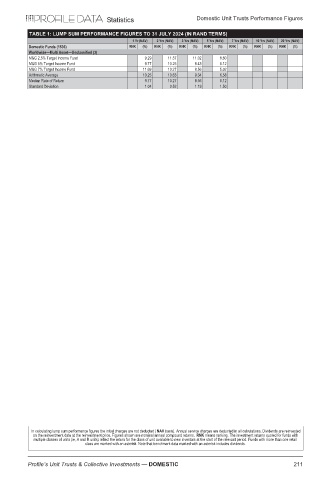
Statistics                Domestic Unit Trusts Performance Figures

         TABLE 1: LUMP SUM PERFORMANCE FIGURES TO 31 JULY 2024 (IN RAND TERMS)
                                       1 Yr (NAV)  2 Yrs (NAV)  3 Yrs (NAV)  5 Yrs (NAV)  7 Yrs (NAV)  10 Yrs (NAV)  20 Yrs (NAV)
         Domestic Funds (1536)        RNK  (%)  RNK  (%)  RNK  (%)  RNK  (%)  RNK  (%)  RNK  (%)  RNK  (%)
         Worldwide—Multi Asset—Unclassified (3)
         M&G 2.5% Target Income Fund      9.29   11.37  11.02   8.60
         M&G 5% Target Income Fund        9.77   10.25  8.43    6.12
         M&G 7% Target Income Fund        11.69  10.27  8.56    5.02
         Arithmetic Average               10.25  10.63  9.34    6.58
         Median Rate of Return            9.77   10.27  8.56    6.12
         Standard Deviation               1.04   0.52   1.19    1.50


          In calculating lump sum performance figures the initial charges are not deducted (NAV basis). Annual service charges are deducted in all calculations. Dividends are reinvested
          on the reinvestment date at the reinvestment price. Figures shown are nominal annual compound returns. RNK means ranking. The investment returns quoted for funds with
           multiple classes of units (ie, A and R units) reflect the return for the class of unit available to new investors at the start of the relevant period. Funds with more than one retail
                         class are marked with an asterisk. Note that benchmark data marked with an asterisk includes dividends.

         Profile’s Unit Trusts & Collective Investments — DOMESTIC                   211